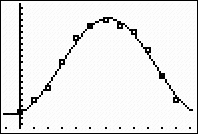
 Location: Syracuse, NY
Regression Equation:
y=12.7167sin( .5090x-1.6272)+8.5776
 Location: Cairo, Egypt
Regression Equation:
y=7.801sin(.4637x-1.3023)+20.3892
Amplitude: 12.7167; Vertical Shift: 8.5776
 Location: Cairo, Egypt
Regression Equation:
y=7.801sin(.4637x-1.3023)+20.3892
Amplitude: 7.801; Vertical Shift: 20.3892
 Location: Gjirokastër, Albania
Regression Equation:
y=9.1214sin(.5585x-1.9575)+14.0148
Amplitude: 9.1214; Vertical Shift: 14.0148
1) In all of the equations, the amplitude represents the difference between the extremes and the wrap line. Therefore, if a location's graph has a higher amplitude, there will be a greater difference between the high and low temperatures. The vertical shift represents the median temperature of the location. 'X' represents the month (0=January.) 'Y' represents the temperature in degrees Celsius.
2) All the data sets are different, as they are from three distinct locations. However, the average temperature of each location can be modeled with a sine equation because it starts at a maximum, decreases, increases again, and repeats after a period of 12 months. The farther from the equator a location is, the lower its vertical shift is. The greatest amplitude occurs around 40°N.
3) My ideal temperature is 21 °C. The best month to travel to Cairo would be April, as the average temperature is 21° C. October and November are also close, with average temperatures of 23 °C and 19 °C. The best months to travel to Gjirokastër are June and July, which have average temperatures of 20 °C and 23 °C
No comments:
Post a Comment
Be constructive, positive, and please keep your comments appropriate to a classroom setting.
Note: Only a member of this blog may post a comment.